
New CourseT1C1-L07 — Standard 1.3: Analyze Public Health Data, Share Findings, and Use Results to Improve Population Health
Uncategorized
About Course
T1C1-L07 — Standard 1.3: Analyze Public Health Data, Share Findings, and Use Results to Improve Population Health
This lesson provides practical guidance on PHAB Standard 1.3, covering Measures 1.3.1 and 1.3.2. Learners will develop skills in evaluating quantitative and qualitative population health analysis, identifying meaningful findings and disparities, assessing dissemination practices, and demonstrating how data inform public health decisions and actions. The lesson emphasizes evaluating accreditation documentation and tracing evidence from data analysis to informed public health action.
Target Audience: Accreditation coordinators, health department leaders, epidemiologists, population health analysts, quality improvement professionals, and public health program managers.
Time: 20 mins
Course Content
T1C1-L07 — Standard 1.3: Analyze Public Health Data, Share Findings, and Use Results to Improve Population Health
T1C1-L07 — Standard 1.3: Analyze Public Health Data, Share Findings, and Use Results to Improve Population Health
Lesson Purpose
Standard 1.3 completes the data-to-action progression of Domain 1.
Earlier standards focus on developing a comprehensive understanding of population health and collecting or accessing additional information. Standard 1.3 asks what the health department does with that information.
The health department must be able to analyze population health data, interpret what the analysis reveals, communicate meaningful findings to appropriate audiences, and use those findings to recommend or inform public health action.
The progression is:
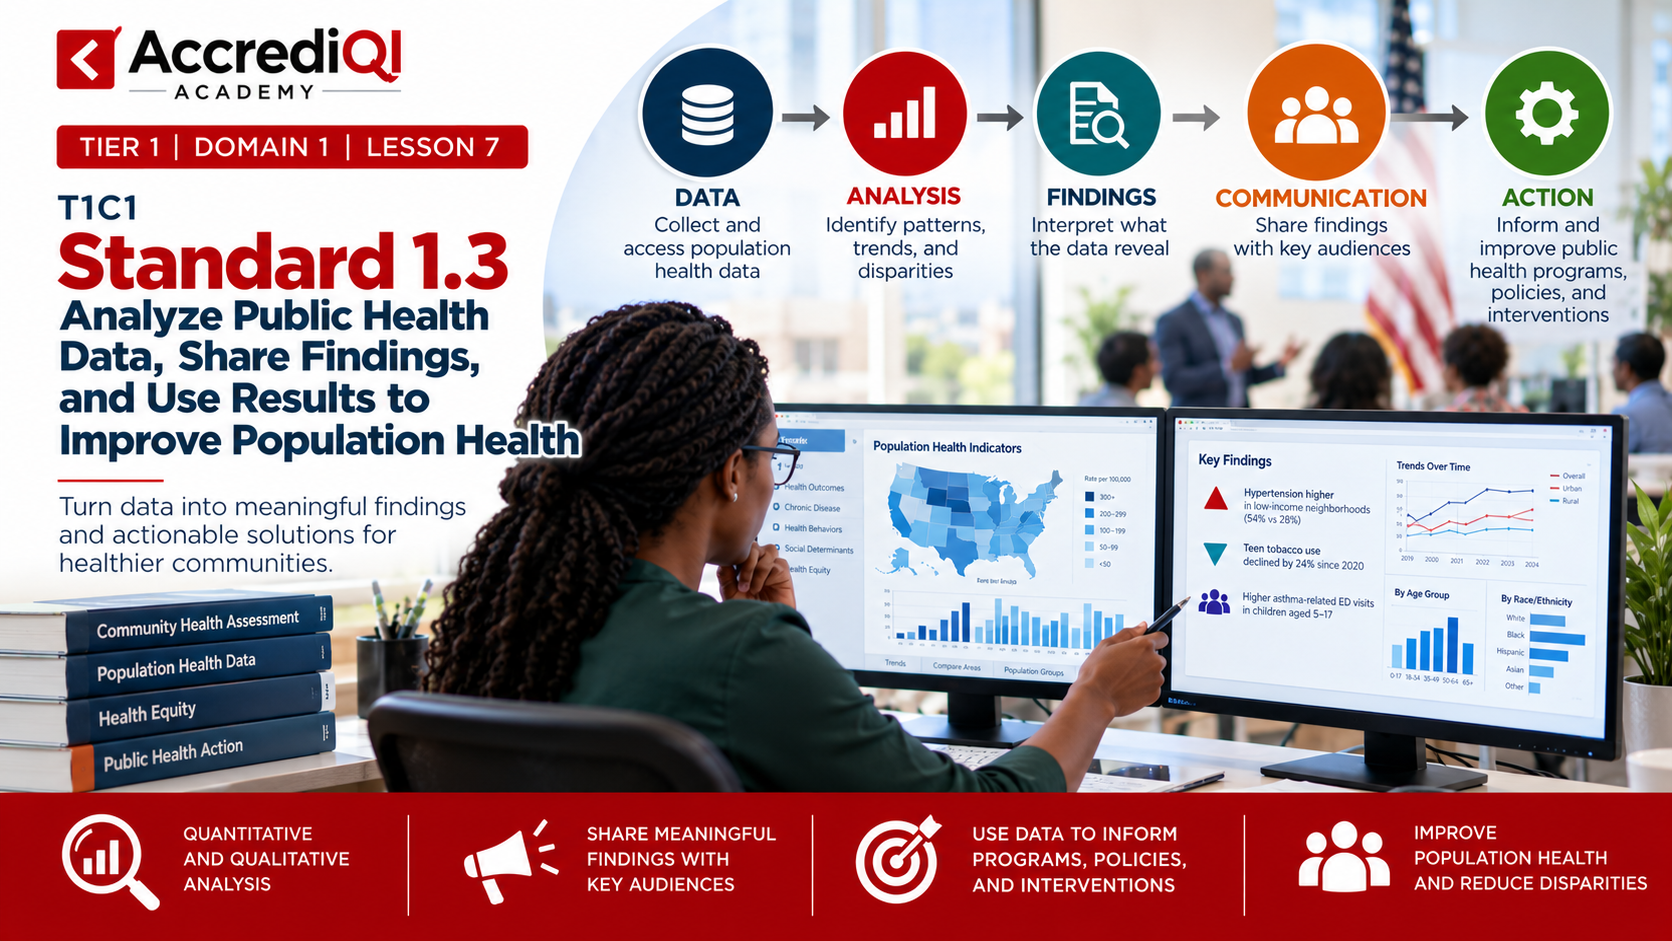
DATA → ANALYSIS → FINDINGS → COMMUNICATION → ACTION
For the Accreditation Coordinator, the competency is not simply finding reports that contain data. You must be able to recognize meaningful analysis, evaluate whether conclusions are supported by the evidence, determine whether findings were actively communicated, and trace those findings into public health decisions and actions.
Standard 1.3 contains two measures:
Measure 1.3.1 — Results from quantitative analysis of data relevant to public health
Measure 1.3.2 — Use data to recommend and inform public health actions
Learning Objectives
By the end of this lesson, you will be able to:
T1C1-L07-LO1 — Differentiate quantitative and qualitative population health analysis and determine how each contributes to interpreting population health conditions.
T1C1-L07-LO2 — Evaluate whether quantitative analysis demonstrates meaningful comparisons and whether resulting findings have been intentionally shared with appropriate external audiences.
T1C1-L07-LO3 — Evaluate qualitative analysis to determine whether experiences, perspectives, observations, and other qualitative information have been systematically interpreted to identify meaningful themes and findings.
T1C1-L07-LO4 — Trace the evidence pathway from population health data through analysis and findings to a recommended or informed public health action.
T1C1-L07-LO5 — Assess documentation for Measures 1.3.1 and 1.3.2 and identify gaps that could prevent the evidence from demonstrating the required public health practice.
Watch the Lesson
As you watch this lesson, focus on one central idea:
Data alone are not the destination.
A health department may collect substantial amounts of population health information. But the value of those data emerges when the organization can:
analyze them → understand what they reveal → communicate the findings → use the findings to inform action.
This is the core capability evaluated by Standard 1.3.
From Data to Understanding
Analysis transforms data into information that can support decision-making.
The lesson distinguishes two complementary forms of analysis.
Quantitative Analysis
Quantitative analysis uses numerical information to identify:
patterns,
trends,
differences, and
relationships.
A useful question is:
“What is happening—and to whom?”
Qualitative Analysis
Qualitative analysis examines:
experiences,
perspectives,
observations, and
other qualitative information
to identify meaningful themes.
A useful question is:
“Why might this be happening?”
Used together, quantitative and qualitative analysis can provide a deeper understanding of population health than either approach alone.
Measure 1.3.1 — Analyze Data and Share Findings
Measure 1.3.1 evaluates the health department's capacity to turn population health data into meaningful findings.
The lesson addresses two Required Documentation areas:
RD1 — Quantitative Analysis
RD2 — Qualitative Analysis
The important competency is understanding that analysis goes beyond reporting information.
RD1 — Quantitative Analysis
For RD1, the health department must demonstrate meaningful quantitative analysis of data relevant to population health.
The lesson emphasizes that this RD is specific to population health data. Program evaluation, customer satisfaction, and employee satisfaction data are not acceptable substitutes.
A strong practice is to analyze the same population health data collected or presented under Standard 1.2, demonstrating continuity between collecting the data and using the data.
Reporting Numbers Is Not Enough
Suppose a health department reports:
54% of participants had hypertension.
That is useful information, but by itself it provides limited understanding.
Meaningful analysis asks:
Compared with what?
The lesson identifies several ways to make meaningful comparisons.
Compare Across Places
Compare the jurisdiction with other socio-geographic areas, sub-state regions, the state, or the nation.
Compare Across Population Groups
Compare results across characteristics such as:
age,
gender,
race,
ethnicity, or
socioeconomic status.
Compare Over Time
Compare the same population across different time periods to identify trends.
The lesson also strongly recommends incorporating health equity analysis by examining differences across populations or places.
The goal is to move from:
“Here is the number.”
to:
“Here is what the number tells us about the health of our population.”
The deck summarizes this distinction as using numerical data to identify patterns, trends, differences, and relationships.
From Analysis to Findings
Analysis produces evidence.
The health department must then interpret that evidence.
For example, suppose blood-pressure data show:
substantially higher hypertension prevalence among older adults,
higher prevalence among men than women,
differences by race and ethnicity, and
higher rates in particular neighborhoods.
The individual percentages are results.
The finding comes from interpreting those results.
For example:
“Black men age 55 and older living in the Central and Riverside districts experience the highest burden of elevated blood pressure.”
That statement identifies something meaningful about the population.
The Accreditation Coordinator should therefore be able to distinguish:
DATA — the information collected.
ANALYSIS — what was done to examine the information.
RESULTS — what the analysis produced.
FINDINGS — what those results mean for population health.
Sharing the Findings
Producing a meaningful finding is not the end of RD1.
The lesson also requires evidence that findings were shared with external audiences.
A critical distinction is between:
making information available
and
actively communicating findings.
Simply placing a report on a website is passive availability. The lesson specifically indicates that passive website posting is not sufficient.
Instead, demonstrate intentional dissemination.
Examples presented in the lesson include:
emailing findings or recommendations to partners or community organizations,
presenting findings to a governing entity,
sharing findings at a community event,
using social media to direct audiences to findings, reports, or dashboards, and
distributing printed summaries in community settings.
Communication should also be appropriate to the intended audience.
A technical epidemiologic report may be appropriate for one audience but ineffective for another. Plain language, summaries, visualizations, presentations, or other formats may be needed to make the findings accessible.
The question is not simply:
“Did we publish it?”
Ask:
“Who needed this information, how did we communicate it to them, and can we demonstrate that communication?”
RD2 — Qualitative Analysis
Numbers tell only part of the population health story.
Qualitative information can provide insight into people's experiences, perceptions, observations, and explanations of community conditions.
Sources may include:
focus groups,
interviews,
listening sessions,
structured observations,
community discussions, and
other qualitative methods.
But collecting qualitative information is not the same as analyzing it.
The health department must interpret the information to identify meaningful themes or findings.
For example, residents may repeatedly describe:
transportation difficulties,
cost barriers,
limited healthy-food access,
safety concerns, or
difficulty obtaining culturally appropriate services.
The analysis should identify recurring or significant themes rather than simply reproduce comments.
The core progression is:
QUALITATIVE INFORMATION → ANALYSIS → THEMES → FINDINGS
Quantitative information may identify where or among whom a problem is concentrated.
Qualitative information may help explain why the problem may be occurring.
Together, they strengthen the department's understanding of population health.
The Accreditation Coordinator's Analysis Test
When reviewing evidence for Measure 1.3.1, do not begin by asking:
“Do we have a report?”
Instead ask:
What population health data were analyzed?
What analysis was performed?
What comparisons were made?
What did the analysis reveal?
What findings were developed from the results?
For qualitative data, what themes emerged from the analysis?
Who outside the health department received the findings?
How were the findings intentionally communicated?
These questions shift accreditation preparation from document collection to evidence evaluation.
Measure 1.3.2 — Use Data to Recommend and Inform Public Health Actions
Measure 1.3.2 moves Standard 1.3 from understanding to action.
The complete progression is:
1. COLLECT / ACCESS
Population health data
↓
2. ANALYZE
Identify patterns and disparities
↓
3. DEVELOP FINDINGS
Interpret what the data mean
↓
4. SHARE FINDINGS
Communicate with others
↓
5. TAKE ACTION
Recommend or inform public health action
The deck poses the central question for Measure 1.3.2:
“What did the health department actually do with what it learned?”
The destination is therefore not the report.
The destination is informed action.
Required Documentation for Measure 1.3.2
The lesson identifies one Required Documentation requirement.
The health department must provide two examples demonstrating the practice.
Findings may be used to:
develop a new program or policy,
expand an existing program,
revise a policy, or
seek funding to support a public health intervention.
Potential documentation includes:
grant proposals,
funder or program progress reports,
reports or presentations to a governing entity,
quality improvement charters, or
other documentation that clearly connects the findings to the proposed or implemented action.
The key is not the type of document.
The key is whether a reviewer can follow the evidence trail:
DATA → FINDINGS → RECOMMENDED OR INFORMED ACTION
The documentation must make that connection visible.
Follow the Evidence Trail
This is one of the most important Accreditation Coordinator competencies in Standard 1.3.
Suppose a department has:
a population health report,
a grant proposal,
a QI charter, and
a new intervention.
Those documents do not automatically demonstrate Measure 1.3.2 merely because they exist.
The Accreditation Coordinator should ask:
Can I trace the action back to the findings?
For example:
Data: Blood-pressure clinic data
↓
Analysis: Rates compared across populations and geographic areas
↓
Finding: Black men age 55 and older in Central and Riverside experience a disproportionately high burden
↓
Partner Interpretation: Health Equity Coalition reviews the findings
↓
Recommendation: Develop a targeted intervention with the health center
↓
Action: Grant proposal and QI charter created to implement the intervention
That is a coherent evidence trail.
The lesson's blood-pressure example demonstrates precisely this progression: analysis identified a priority population, partners reviewed the findings, and the findings informed a targeted intervention.
Documentation Should Show the Connection
A grant proposal can be excellent evidence if it explains:
the finding → the identified need → the proposed intervention.
A QI charter can also be strong evidence if it shows:
the finding → the problem statement → the priority population → the improvement aim → the intervention.
The deck's examples use both a grant proposal and a QI charter to demonstrate how findings concerning blood-pressure disparities were translated into an intervention.
This gives the Accreditation Coordinator an important rule:
Do not judge documentation only by its title. Judge whether the document establishes the evidence trail required by the measure.
The Accreditation Coordinator's Evidence Test
For each potential Measure 1.3.2 example, ask:
1. DATA — What population health data informed the work?
2. ANALYSIS — What did the department learn from those data?
3. FINDING — What significant issue, population, disparity, or priority was identified?
4. ACTION — What public health action was recommended or informed?
5. CONNECTION — Does the documentation clearly demonstrate that the findings informed that action?
If the reviewer has to infer the connection, the evidence trail should be strengthened.
Standard 1.3 as an Organizational Capability
Standard 1.3 should not be treated simply as an accreditation documentation exercise.
A mature public health organization routinely moves through the cycle:
ASSESS → COLLECT → SHARE DATA → ANALYZE → IDENTIFY FINDINGS → COMMUNICATE → ACT
The conclusion of the lesson emphasizes that Domain 1 is not a collection of disconnected tasks. It is a continuous cycle in which data strengthen decision-making and ultimately support better population health.
The Accreditation Coordinator's role is therefore not merely to locate evidence after the work has occurred.
The stronger role is to help the organization establish practices that routinely:
generate useful population health information,
analyze that information,
identify disparities and priorities,
communicate findings,
engage partners in interpreting the findings,
use the findings in decisions and actions, and
preserve an evidence trail showing how those decisions were informed.
Key Takeaway
Standard 1.3 closes the loop between knowing and doing.
A health department should be able to demonstrate:
We collected or accessed meaningful population health data.
We analyzed those data.
We determined what the results meant.
We communicated the findings to others.
We used what we learned to inform public health action.
For the Accreditation Coordinator, the essential competency is being able to follow—and help the organization build—the evidence trail from data to action.
-
T1C1-L07 — Standard 1.3: Analyze Public Health Data, Share Findings, and Use Results to Improve Population Health
26:21 -
T1C1-L07 — Lesson Knowledge Check